
Seven Technologies Gleaned from 2017 Esri DevSummit
/
Vector Tiles and Basemaps
Vector tiles provide improved performance and customization for layers and basemaps. Rather than creating static tile images for all the various zoom levels, vector tiles allow you to publish the layer's base tiles unstyled, and customize later with JSON. For example, Esri® traditionally published a few popular basemaps (streets, terrian, topo, etc.) that consist of image tiles for all the various zoom levels. These basemaps are great, but the images were static. With vector basemaps, Esri provides users with a neutral dark grey basemap canvas, and the user can edit the hex colors for the water, land, urban areas, boundary colors, and labels components.
KOOP
KOOP is an open source server application that is able to consume geospatial feature data from foreign APIs that are not Esri-based or GeoJSON-based, and transform this data so it can be consumed by an Esri mapping application. The output formats include GeoJSON, CSV, KML, Shapefile, and a HTTP response similar to an ArcGIS Feature service. To bring in a new geospatial API, a small amount of code is needed for the translation between the APIs, and KOOP takes care of the heavy lifting. An Esri developer demonstrated consuming the Craigslist API and the Yelp API to load filtered apartments and restaurants onto an Esri map.
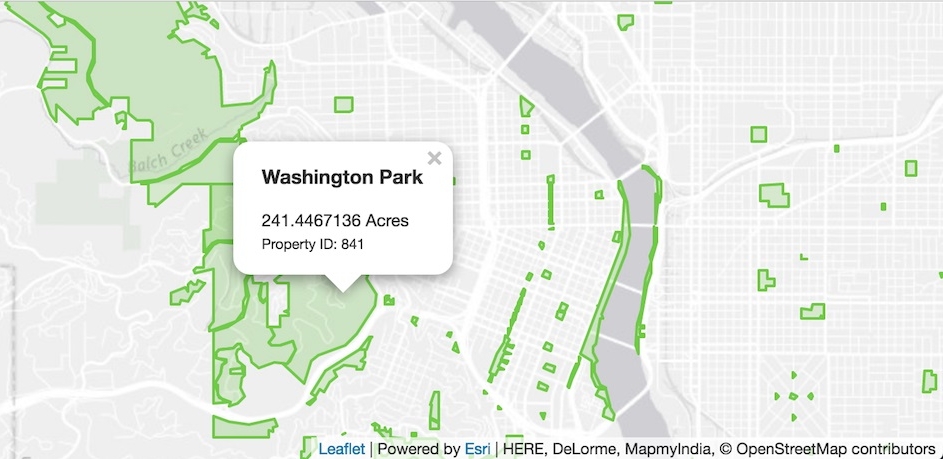
Esri Leaflet
Esri Leaflet
Developers at Esri continue to enhance the open source Leaflet plugins on Github. This is to allow developers who prefer Leaflet and GeoJSON to still use ArcGIS basemaps, feature layers, and other Esri map services. The presenter demonstrated how you can easily create a plugin to use the Esri routing engine within a Leaflet map.
Geodev Hackerlabs
Geodev Hackerlabs is an open source set of tutorials for learning how to develop ArcGIS applications. Tutorials include performing analysis tasks in ArcGIS online such as filtering layers, intersecting layers, and creating buffers. Other tutorials involve coding using the ArcGIS JavaScript API to perform tasks like creating maps, adding layers, styling popups, creating custom themes, and buffering. The tutorials involve writing code in jsbin.com, an online code-editing tool like jsFiddle and Plunkr.
Cedar

Cedar
Esri demonstrated Cedar, an open source JavaScript library for creating visualizations of data from ArcGIS services. It is built on the popular D3.js visualization library. Developers can quickly write code to request data from a Feature Service, and create visualizations like bar charts, pie charts, and scatter plots.
Calcite Web
Calcite Web is a CSS and JavaScript framework that is very similar to Bootstrap, except that it's tailored specifically to Esri map Web applications. Developers use it to create a pleasurable and consistent web experience for maps. It has an online style guide for buttons, labels, panels, alerts, components, icons, and typography.
Open Data
In February, Esri released more features to the Open Data portal to make it easier for site administrators to manage and customize their organizations' Open Data offerings. The presenter showed how to create pages, edit with markup and markdown capabilities, and customize the look and feel. He also displayed award-winning Open Data sites, including Kenya, Africa and Raleigh, NC.
By: James Lawruk, Developer
Photos retrieved from GitHub, Inc.