
What is Linear Referencing?
/A Guide to LRS and Establishing a Strong Enterprise Data Foundation

Our diverse, complex infrastructure systems comprise numerous linear networks, from transportation to gas, water, and utility systems. Each organization needs systems for data collection and data management. Linear referencing introduces clarity and structure, creating opportunities to enhance efficiency, reduce costs, and improve decision-making.
Navigating the volume of infrastructure network data can be equated to travelers traversing today’s highway systems, electricity navigating along power lines, or gas passing through pipelines. Just as commuters rely on signage and markers, departments of transportation (DOTs) need their reference systems. Enter linear referencing. Focusing on the transportation environment, this article will define an LRS, outline an LRS structure, and illuminate how an LRS enhances data management and paves the way for future technological integrations.
What is Linear Referencing?
As its name implies, linear referencing identifies the location of business data as points and lines (geographic locations) along a measured linear feature, e.g., road, highway, utility pipeline, etc. Each point is measured from a fixed location, e.g., the beginning of a route, state border, intersection, etc. DOTs may also manage and store data relative to a roadway linear feature, such as traffic accident locations, pavement conditions, paint markings, etc.
Linear Referencing Systems

An LRS is a set of procedures or methods used to specify a location along a linear feature from a single point with a known location as a distance.
Building on the definition of linear referencing, a linear referencing system (LRS) is a set of methods and procedures for specifying a location as a distance along line features from a point with a known location. An LRS allows users to locate, acquire, and store location references in various systems, adding powerful business intelligence and data management tools to an agency’s toolbox.
An LRS allows for sharing data throughout the enterprise by translating data into the specific needs of each business department based upon a common reference (i.e., basecamp). Leveraging an enterprise LRS helps reduce the need for building and maintaining complex data object relationships within system database architecture. The LRS provides the opportunity to provide real-time data access and helps eliminate the need for manual processing and coding.

A source for data integration across the entire organization.
A comprehensive tool to meet business data reporting needs.
A transformation tool that enables data to be stored and translated for multiple uses.

A specific data management tool that is self-contained and static.
A data storage mechanism for business data, e.g., pavement type, shoulder type, speed limit, etc.
Only used for a single reporting function, i.e., federal reporting.
Linear Referencing Methods
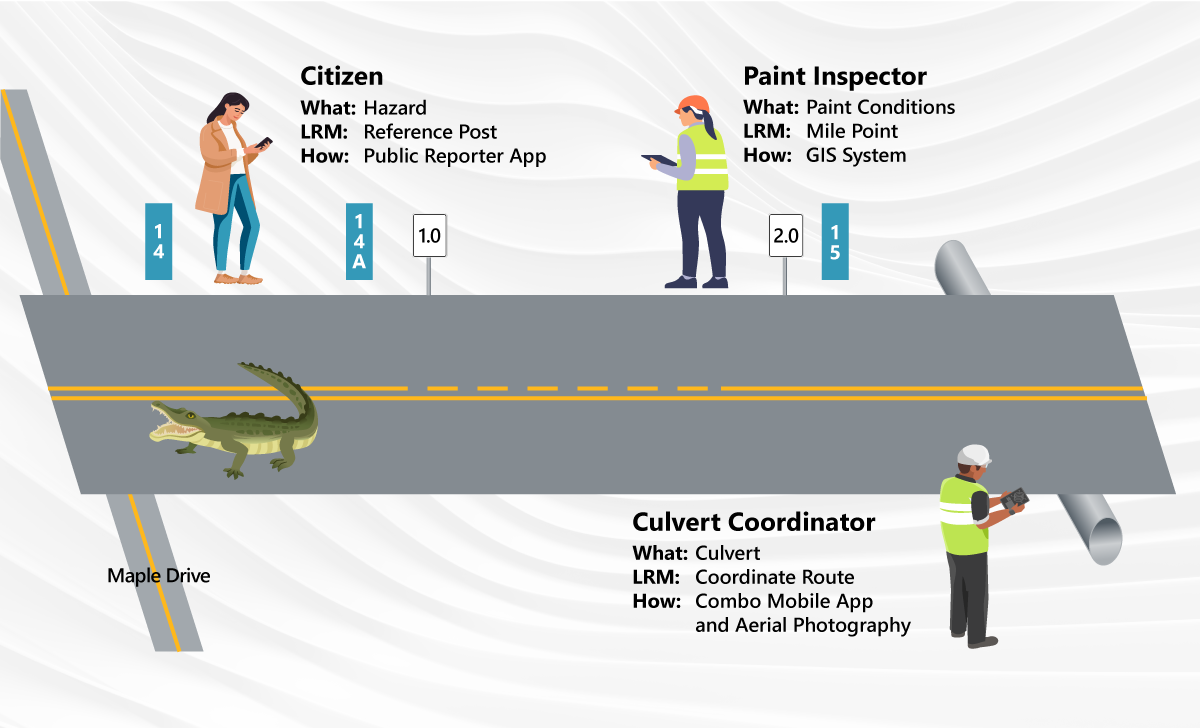
A linear referencing method (LRM) often gets confused with an LRS. An LRM is the method used to locate data on the network. DOT-specific examples include:
Mile points: 8.46 miles from the beginning of route I-80.
Coordinates and/or coordinate route combinations: 40.91152, 74.73571, and route I-80.
Reference posts, also known as mile markers, with or without an offset: Post 111 and offset 0.4 miles on I-80.
Stationing with or without an offset: Station 300+50.
Intersections, with or without an offset: 200 feet east of the intersection of Main St. and State St. along State St.
Physical addresses: 207 Senate Ave., Camp Hill, PA 17011-2316.
The primary LRMs that DOTs use are:
Mile points.
Coordinate routes.
Reference posts.
Stationing.
Dynamic Segmentation
Dynamic segmentation allows agencies to take data stored in various LRMs, locate the data along a route network, and segment (or break) the data based on changes within the data. Here is a simple process to see how dynamic segmentation works:
Leverage common route geometry from the LRS and across LRMs.
Break geometry into smaller segments by the business data attributes.
Store the breaks within the geometry and the business data attribution for visualization, spatial analytics, and reporting.
Linear Overlay
Linear overlays create opportunities to complete holistic research and identify patterns within the types of data. As shown in the following graphic, an example research opportunity is to identify problems in the road network where the pavement condition is poor, the speed limit is less than 35 miles per hour, there are fewer than four lanes, and the annual average daily traffic (AADT) exceeds 12,000 vehicles.
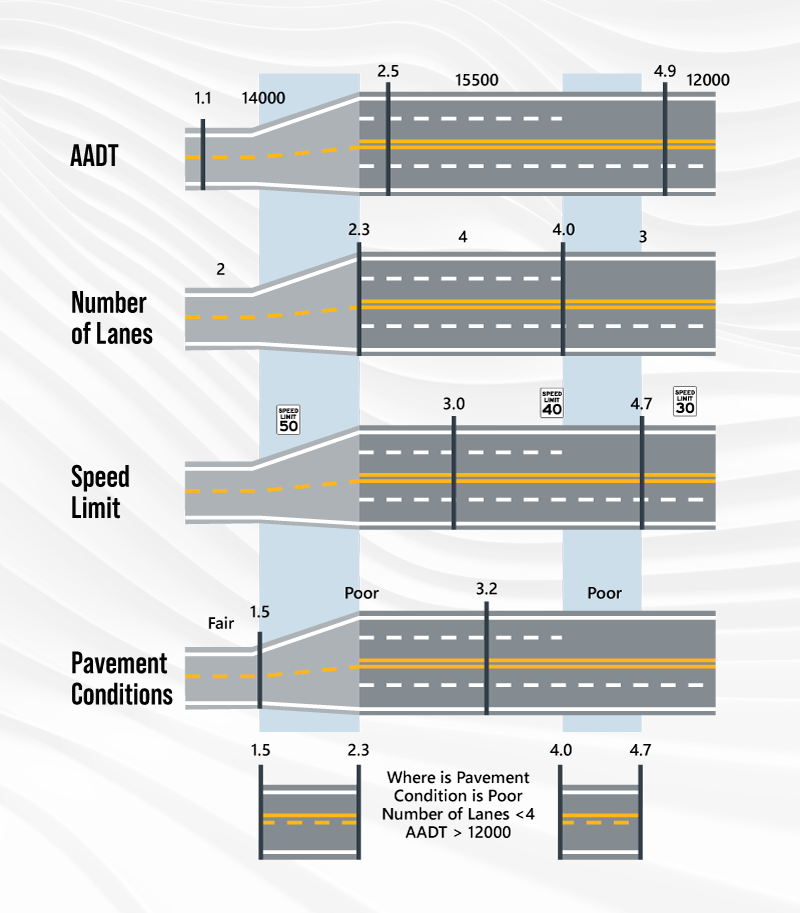
Dynamic segmentation allows linear overlays to combine individual components, e.g., AADT, number of lanes, speed limit, and pavement conditions. The end result allows patterns to be identified.
Linear overlays collapse all of the dynamically segmented pieces of data together and:
Takes each dynamic segment.
Overlays the segments together.
Creates a combined output based on the input.
Provides the opportunity to identify patterns in the data.
Once an organization detects patterns within the data, it can take the corresponding follow-up actions. These actions might be to correct errors within the data or ask further questions about the data (e.g., why certain road conditions exist at this location). The ability to discern and analyze data in this manner provides for data-driven decision-making. Tools and processes are available to automate the dynamic segmentation and linear overlay procedures.
Data Standards
Establishing data standards is crucial for data management and seamless system integration. A significant benefit of implementing data standards is the reduced need for continuous data transformation and validation. From a data governance perspective, data standards are the protocols for collecting, storing, structuring, presenting, analyzing, and formatting data. Standardizing these protocols allows for trusted use of the validated data. Data standards serve as a universal language, facilitating uniform data utilization. Implementing and enforcing data standards increases efficiency, eliminating back-and-forth data translation between multiple data sources.
Implementing enterprise data standards reduces continuous data transformation, facilitates data uniformity, and allows reliable use of validated data.
Setting the Stage for Esri ArcGIS Roads and Highways
With a functional enterprise LRS, standard LRMs, and instituted data governance practices, agencies and organizations can take steps to effectively implement additional systems, such as Esri Roads and Highways. ArcGIS Roads and Highways establishes an enterprise route network management system that enables DOTs to manage road inventory data along their LRS.
Using ArcGIS Roads and Highways allows organizations to leverage:
Tools to manage and maintain the enterprise LRS route network.
Functionality to create and update road inventory data.
Automated quality control through data validation rules.
Standardize LRMs.
Spatial and temporal datasets for analysis and decision-making.
Coordinated and streamlined workflows.
Stay tuned for our next article, which will focus on implementing ArcGIS Roads and Highways. In the meantime, please read our Data Fabric for DOTs blog to learn more about how other DOTs use an LRS.
Making the Transformation
Establishing an enterprise LRS is the first step in implementing a data management strategy and improving business decisions. With data governance at its core, agencies can introduce additional technologies, such as building information modeling (BIM) and other data modeling connections. Bringing all technologies together creates endless possibilities.
The return on investment (ROI) on a solid and reliable data foundation is significant, and the time is now!
About the Author

Eric Abrams
Senior Project Manager
Email Eric
Connect on LinkedIn
Get to Know Eric