Insurance and Spatial Information, a Perfect Match
/Understanding the world through a spreadsheet can be very difficult. Sure, you can see the address, the business line, or the Total Insured Value for one of the policies. But, it is very difficult to see how that one policy relates to the next policy, or if there is a relationship. GeoDecisions has been helping our insurance partners make sense of the spatial information found in a spreadsheet for many years. Focusing on visualization of our partners’ portfolios, we use the latest Esri® technologies to display, aggregate, symbolize, and compare policies, claims, and other attributes. This strategy provides our partners with a more accurate and encompassing view of their portfolio(s).

In addition to the simple display and visualization of partner portfolios, GeoDecisions assists in delivering accurate and informative querying. We develop simple viewing and querying tools that allow our partners to navigate and display complex information with little knowledge of GIS software.
Predictive Analytics, Greater Understanding
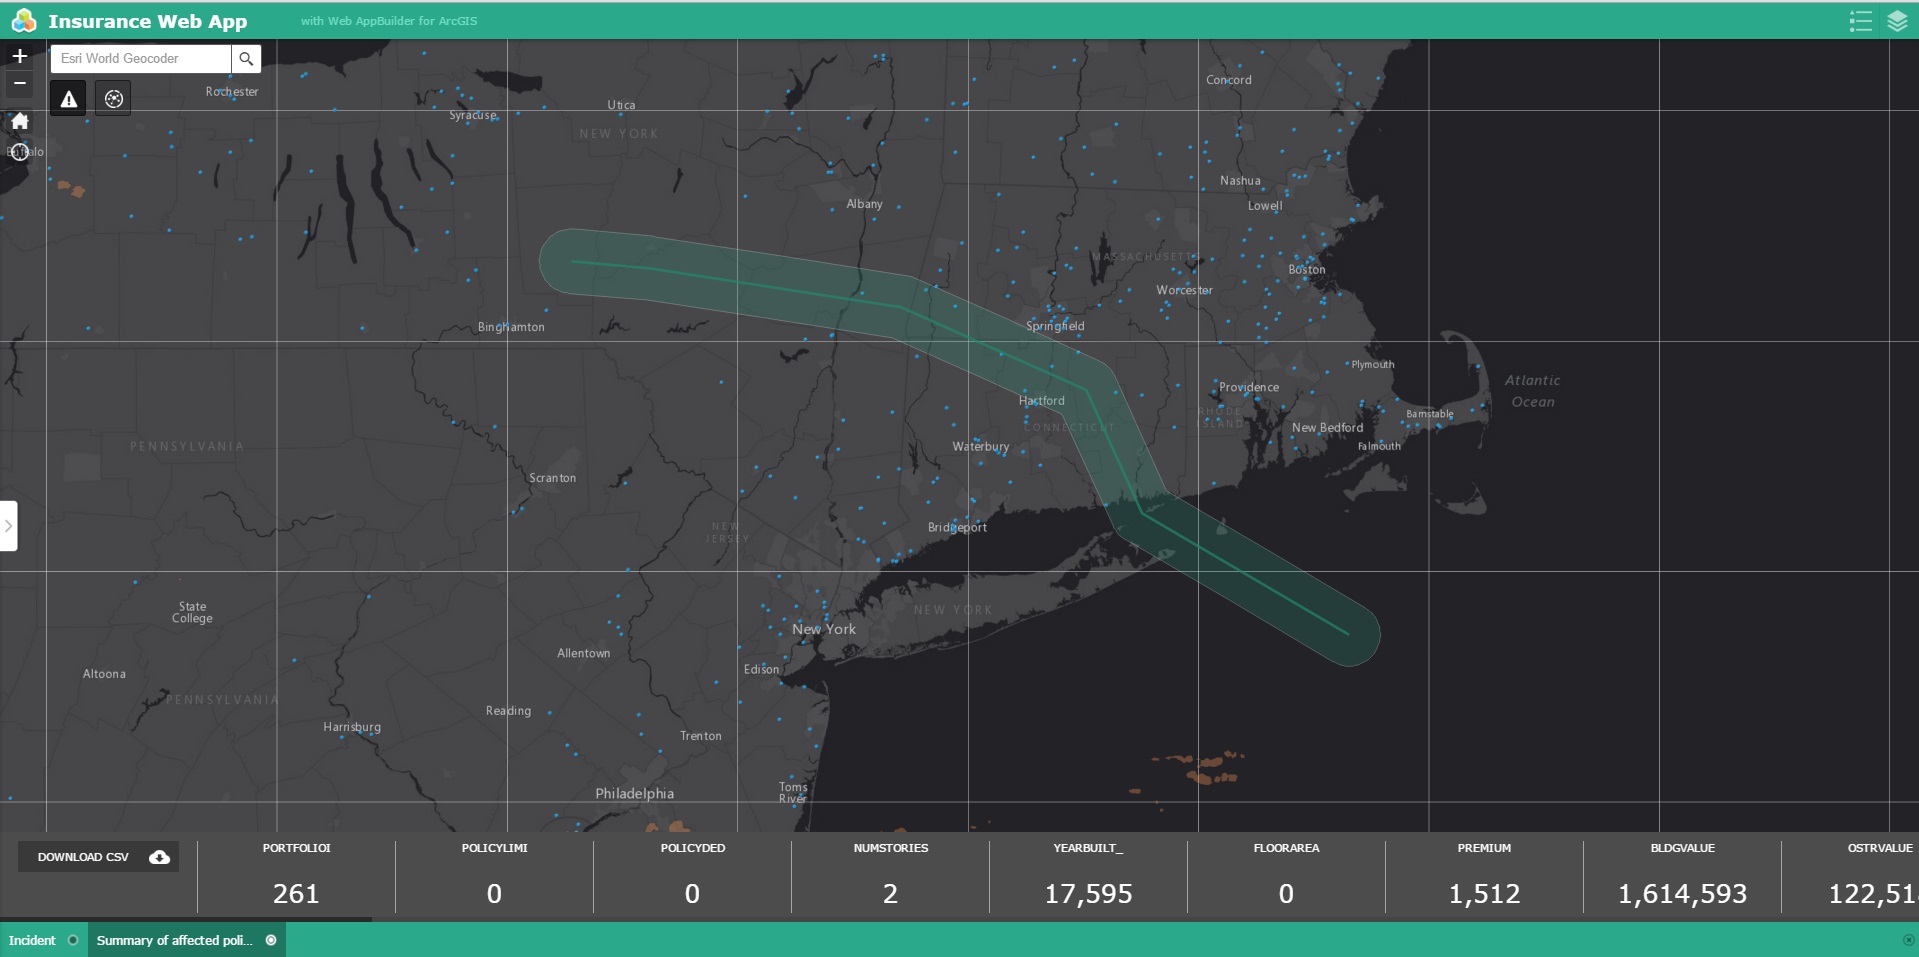
The true power of our solutions is the ability to overlay event data (natural and manmade) and compare the effects of that event to our partners’ portfolios. Consequently, our partners better understand how winds from a hurricane might affect their portfolio and how many claims might be submitted. This information provides the knowledge our partners need to prepare for large-scale disasters, making sure they deploy enough claims managers and proactively understand who might be heavily affected by the disaster.
The historical view of the storm also helps our partners detect claims fraud. The ability to overlay spatial boundaries of a storm and compare those boundaries to a claims data set enables our partners to better understand if a storm or disaster actually caused the damage within the associated claim. By using temporal claims data along with historical storm and disaster data, our partners further understand the likelihood of a given storm causing each claim.
Real Business Value
While visualization is so important to our partners, they also have been able to capitalize on the automation of spatial functionality within their business process. For example, we have teamed with one partner to automate the overlay of weather data on the portfolio, analyze the effects of the related storm, and trigger a text message to our employees within that partner’s organization notifying them when the storm and potential damages reach a define threshold.
The excitement of GIS in the insurance space is growing every day, and GeoDecisions continues to work hard to stay ahead of the technology curve. We look to lead through example and innovation, and our measure of success will continue to focus on our partners’ needs and business workflows.